Lighthouse and PageSpeed Optimization as One of the Ranking Factors
Google PageSpeed has been around long before the Lighthouse. It was an interesting measurement system that wasn’t itself an evaluation system. Yes, it’s a bit complicated, but give us a couple of minutes to explain everything.
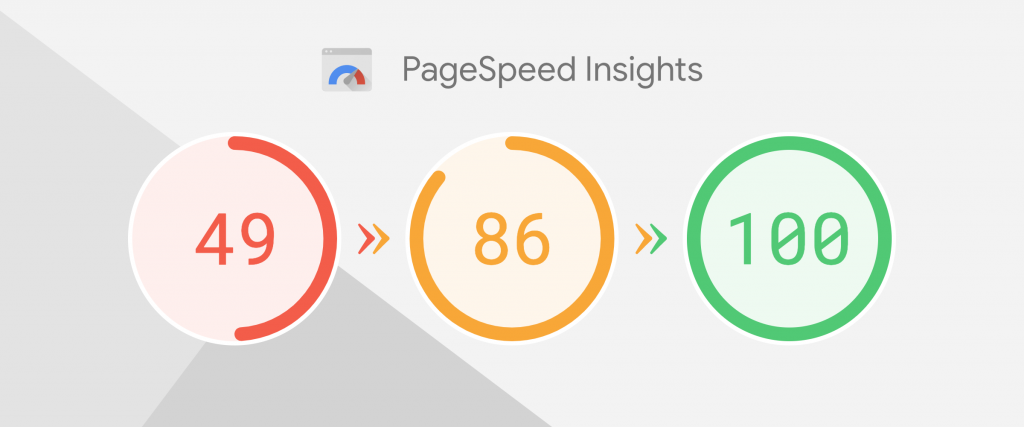
Google Page Speed was like a visualized checklist that reviewed certain criterias that might or might not be present on the site, giving some points to it.
Chronology of the events
- Initially, Google Page Speed worked like this: if you have, for example, client caching, then you get plus 10 points. If you don’t have one, minus 10 points.
- In 2015/2016, there were the first suspicions that something like Google Page Speed had been used by Google. >
- In 2018, Page Speed was replaced by Lighthouse. Google Webmaster reported that from now on, performance evaluation tests is one of the ranking factors. Check this post on the official Google Webmasters blog
What we’ve got NOW:
Page Speed Insights is a service from Google that allows you to determine the performance of a website and provides recommendations for its optimization.
Lighthouse is Google’s browser extension for measuring the quality of web pages.
Does the Loading Speed Affect the Ranking or Not?
Actually, it is easy to check. All you need to do is to create TWO pages with synthetic, non-existent content and periodically optimize the first one for a good score in Insights, while downgrading the second one, on the contrary. Then reverse the pages. Soon enough you will notice the changes on the chart of positions for these two pages, depending on their optimization.
The next question is whether to do speed optimization or not? That is totally up to yourself. Usually, it costs about $500 – $1000. Yes, it is desirable to do site optimization, but if your budget is limited, then “buy backlinks” will guarantee you a better result in comparison to “the green zone” in Page Speed Insights.
What Affects the Number of Points You Get What Are They Awarded for?
If you ask SEO pros, “What do you need to do to get points in the Lighthouse?”, more than half of them will mention one of these options:
- you need to implement lazy load
- you need to take care of reducing the server response time
- you need to do client caching, etc.
Well, none of these have something to do with how Lighthouse works or what it evaluates. Lighthouse does NOT evaluate website loading speed.
Here is a simple example to prove that.
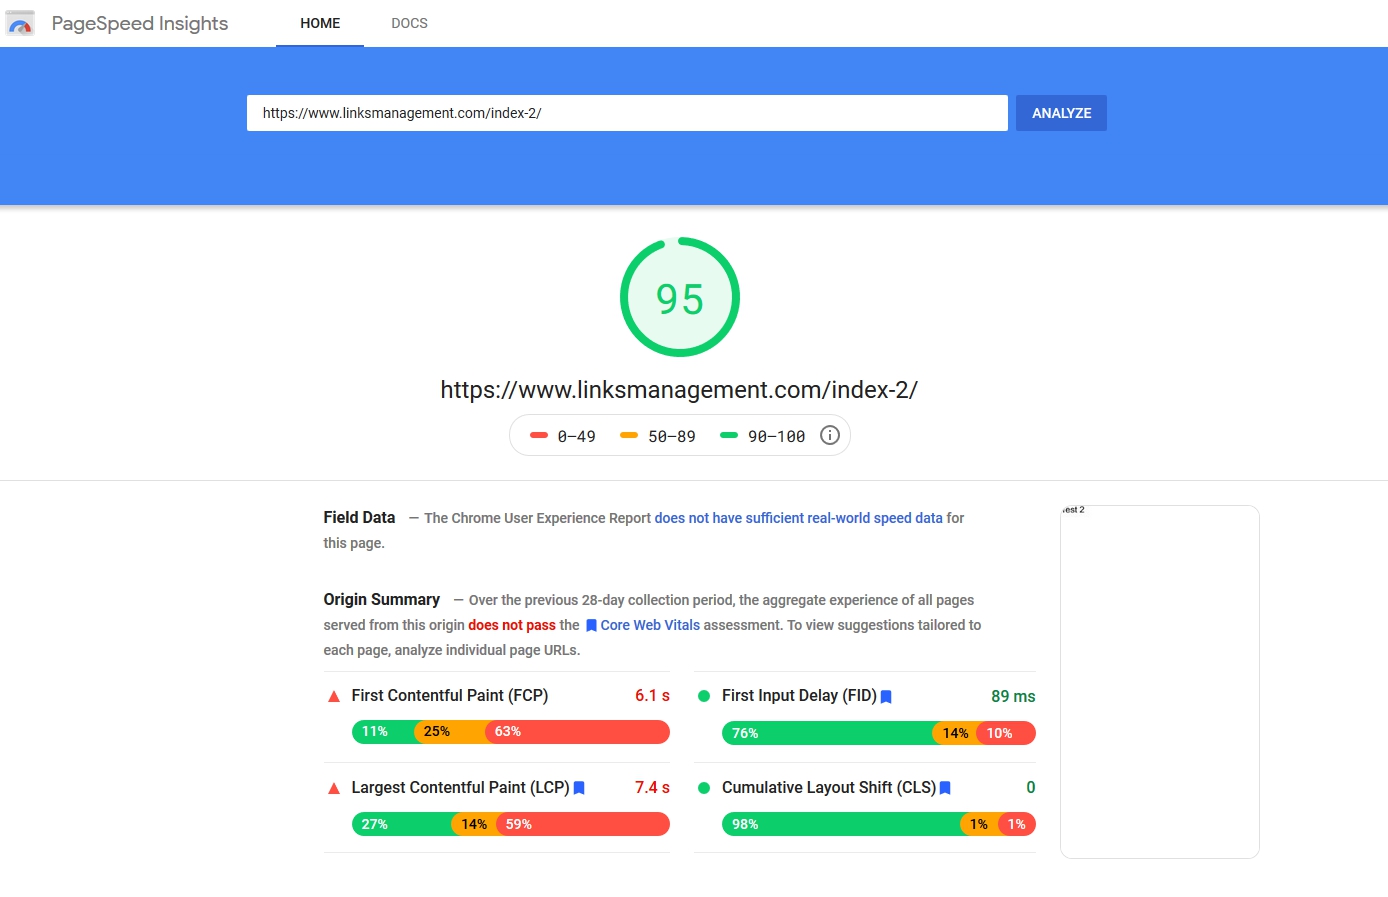
Lighthouse does not measure the site’s loading speed but assesses the rendering capabilities of the site’s first display area. Remember this. The times when you could simply say that is “the beginning” and that is “the end” of the loading of a website are gone now. A lot of sites never finish loading, and in this situation, the engineers who had developed Lighthouse made the right decision.
Because, in fact, loading speed is an objective characteristic. Yes, we can find out how long it takes for a part of the site to appear on the first screen for sufficient interaction. So, the optimization comes down to improve the time after which the user can start interacting with the site.
One of the factors that Google often writes about in the documentation is the time between a request and receiving a response. That is called TTFB (time to the first byte). The impact of this factor on overall performance points is so insignificant. Even if the response is 1.5 sec, you can still be in the green zone. Why? Because it is important for Google how fast the browser received the necessary data and how fast the browser can form the first display area.
The Riddle of Lighthouse and Page Speed Insights
Sometimes the same site can be in Lighthouse’s red zone and in Page Speed Insights’ green zone (and vice versa.) This is due to the fact that Page Speed Insights uses 2 timestamps for displaying the website, while Lighthouse uses 6 of them. If you read the Page Speed Insights papers, they lead to documentation written before 2018, and the Lighthouse papers lead to the Page Speed Insights documentation. At the same time, during the beta testing of Page Speed Insights, there were 6 timestamps. After the release, there are only 2 timestamps left.
“How Important Is a High Google PageSpeed Insights Score for SEO?”
Recently, John Martin Splitt from Google recorded a video where the two of them answer questions about the performance and rankings.
“I wonder if a website’s mobile speed using the Test My Site tool is good and GTmetrix report scores are high, how important is high Google PageSpeed Insights score for SEO?”
Martin commented: “Do what works best for your site and don’t worry, it’s okay if you do something wrong, nothing is going to happen.”
Well, really? You’ve just announced that Lighthouse optimization is one of the key rankings factors, haven’t you? Why did they waffle? There is still no answer to this question.
Here Are What We Know for Sure:
- Experiment confirms that Lighthouse optimization affects site’s performance
- Official posts identify it as a ranking factor
- Officials who say “don’t fool yourself, do what you like”. Why would they do that?
- A console that shows a piece of data
Therefore, it is up to you to go for it or not to. Our opinion is that it is important to optimize the loading speed and enter the green zone, but this is not the key to success in SEO, so this task is not a #1 priority. But in any case remember about the speed with which something is displayed within the first screen.
Key Characteristics:
- the characteristic of displaying something — this is the first timestamp;
- the display of what can be called something meaningful — is the second timestamp;
- content that is formed within the screen area and we can say that the first screen is ready — this is the third timestamp.
- All the Lighthouse does is read these timestamps from the API browser, which are received at the time of rendering.
- All we have to do for optimization is to make sure that these labels are as close as possible to the beginning of the very moment when this render starts.
- The very first and main influencing factor is the load on the central processor, which creates our wonderful java script with which we fill our site.
How to Start Optimization:
- Insert all your css styles into the document header;
- Disable your javascript;
- Conduct an analysis in a Lighthouse and see that most likely your grade will be above 90 points.
Then optimize and differentiate the load that your scripts create, which directly load the processor and slow down the rendering.
Most projects, maybe even all of them, have a Google Analytics Counter on the site, at best, or Google Tag Manager at worst. These are two things that are recommended to run a website as fast as possible, and these are the very things that are the most likely to slow down your site.
The only way to optimize loading speed is to delay loading of Google Analytics scripts and Google Tag Manager. In this case, the accuracy of analytics will decrease by about 7%. It is also worth considering that all javascript analytics systems have an accuracy of about 10%.
One More Important Thing
When it comes to the lazy load, you will probably say, “I connect the lazy load and see the scores increase dramatically. Then why does it not affect the loading speed and scores in Page Speed?” Well, you solve certain problems on the site only indirectly. This is due to the fact that the image that is in the field of view (on the first screen) requires a big load on the processor and it slows down the rendering.
How Google Actually Measures Speed
In fact, Google collects a snapshot of your visitors who come to your site. Formally, each of them takes measurements with the help of Google Chrome, so it’s exactly the same thing that Lighthouse does.
CPU Load
The main work with optimization for Lighthouse is always related to the minimizing of the load that your code, html, css or javascript creates. In 90%, this is most likely a java script. The easiest way to fix this is to exclude your scripts from the page altogether and write a small script.
The Request Idle Callback API lets the script know when the browser is free to execute something else. When the page is rendered, the scripts wait until it receives a signal from the browser that “something can be done”. Then, we can launch some parts of our scripts. That being the case, we do not interfere with the rendering at all.
Ideally, you should use a technology that is called critical css pass (when you insert the css code of this page inside your page.) Do it step by step, describing only the area that is needed for display, then a little more, etc. There are plugins that can do this.
Collecting all your scripts into one file is a very common recommendation. Why is that? One of the major problems with the modern web is that you have to constantly establish a connection between the browser and the server. This is the most resource-intensive task. Usually, it takes longer than the downloading process itself. The more connections are made, the more the rendering of the page slows down.
Which Tools Can You Use for That?
All you need to do is to open developer tools on Google Chrome and find the “Coverage” there. A tool that has appeared quite recently and is developing rapidly. Coverage allows you to watch how much of your css code and javascript code is actually being executed on this page. Using this tool, you can export and import reports. Actually, you will be very surprised to find out that 90-95% of all the code on the page does not actually execute. If your site is small, then you can even cut these pieces.
In the process of postponing loading and executing scripts, make sure that all interactive elements like a menu are working when the page is loading.
If you are using the HTTP / 2 protocol, then you don’t have to worry about the number of requests at all. Take care of your main audience. For example, people who use the 3G mobile Internet with an unstable signal. You may face a situation where you give up HTTP 2, due to the fact that the main advantage and disadvantage of it is the ability to establish just one single connection within which we transfer all our resources. In case of connection instability, there will be packet losses. Now, HTTP 1 has been expanded to 15 connections. It turns out to be a much more efficient way to load a site on unstable communication channels. If there is an error in any channel, it suspends only 1 connection out of 15 and not the entire connection. It turned out to be a much more practical solution to the problem.
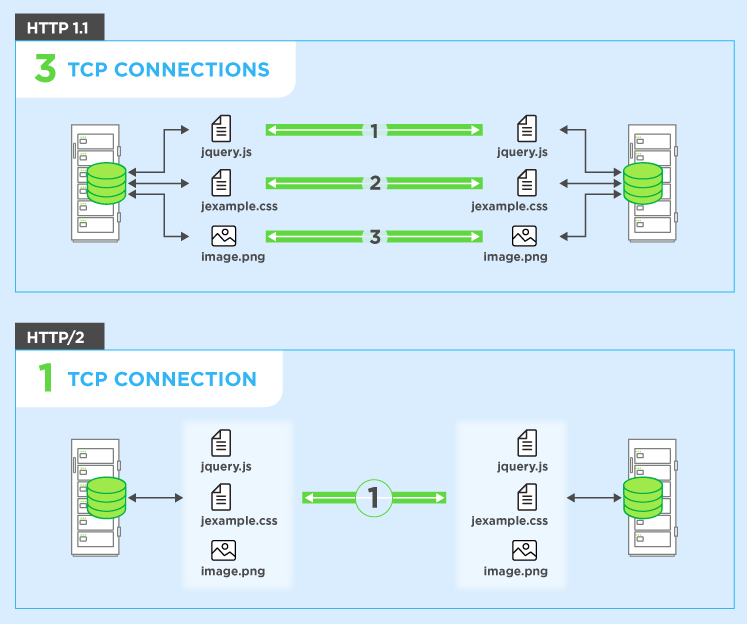
HTTP / 2 is evolving to the extent of allowing more connections. But as soon as more connections are allowed, we effectively fall back on the old HTTP problems.
The main factors that you should pay attention to are:
- The load that your scripts create on the processor at the time of loading the display of the first screen
- any scripts that block rendering should be brought down
- remember that a simple transfer down do not solve the problem
- you may be lucky, the first screen will be rendered while the scripts that were brought down will be loading. In that case, you can get a high score. However, it happens rarely.
- If the rendering of the first part has not finished yet, but the scripts have already been loaded and the interpreter starts compiling them and then executing, you may end up with a high load on the processor and, as a consequence, low scores.
- An usual compilation of 1 MB of code on the phone that takes just a second is a really lot. You will be immediately dropped below 50 points.
- Analytics scripts are the things that create the maximum load. Delaying loading is losing 5-10% of accuracy
- the same thing goes for ad scripts, you can bring them down and don’t activate ads immediately.
Enter URL & See What We Can Do Submit the form to get a detailed report, based on the comprehensive seo analysis.

