Website KPIs: How to Measure Your SEO Effectiveness
Numbers, spreadsheets, and charts are nothing new to SEO experts or marketers. Most of our work is all about those charts. Yet, there are the numbers that rule them all — website KPIs.

These are crucial to understand what’s really going on with your website and how people are seeing it. After all, wouldn’t you want to know if all that content you painstakingly crafted is really hitting it off with the audience?
While that was a rhetorical question, here is a real one — how do you know what KPIs are actually important to track, and what are the right tools to do that? Now, this is what this guide is about.
Contents
What Is KPI in Web Analytics?
Key performance indicators (aka KPIs) for websites are basically a set of metrics that show how well your website is doing. You can think of them as vital signs for your website health.
Say you’ve just launched a new makeup line. Well, chances are that you already have an idea of how many sets you would like to sell by the end of the month or year. Yet, of course, you have to know what sources are the most effective.
By tracking your conversion rate (which is just one of the many web KPIs), you’ll be able to tell how many visitors on your site end up making a purchase. As a result, you can understand if the marketing you do is actually effective.
🤓 Note: The same principle applies across all marketing efforts (not just your web metrics). Whether you are running paid ads or using socials as your “go-to” marketing strategy, you can still track how they’re doing. Still, we’ll concentrate on website performance in this blog.
Why Track Your Web Metrics Performance?
Wouldn’t you like to know if anyone cared about your digital existence? On a more serious note, tracking your web performance is how you can tell if you are reaching the right customers. Plus, it tells a story of how well you can convince the market of your value as a brand.
If these benefits aren’t convincing enough, consider the following ones:
✅ Understand Exactly How Visitors Behave on Your Website
Knowing how much time users spend on your site, which pages they go to, and even which pages they avoid like the plague can be the key to hitting your sales target. Needless to say, all that data will also be a game-changer for your marketing team.
You can use what you find to improve your SEO, content quality, messaging, funnels, and tons of other things. How effective is this, though?
You’ll be surprised. Optimizing a site for customer behavior can help businesses beat their competitors by — wait for it — 85% sales growth. If this isn’t impressive, we don’t know what is.
✅ Come Up With More Targeted Marketing Campaigns
Keeping an eye on your KPI for website traffic tells what kind of content your audience really responds to. This way, you can create something that will actually lead to great results instead of writing content just for the sake of doing it.
But sometimes, it’s not what you write but the platform that might be an issue. That’s why knowing how effective your traffic sources are is vital (literally). Otherwise, your team might be working on something that won’t help you grow your business.
For example, if social media brings more traffic than, say, your newsletter, then you might consider doing more SM content. Because trying to revive your email marketing might be a waste of time.
Alternatively, you could rethink your email marketing strategy and come up with a new one. The same thing happens when you realize that most of your audience is coming from a specific geographical region and none from other places.
This is how you can know exactly what content to use, where to post it, and which areas to target in your campaigns. Talk about having the trifecta for successful campaigns.
✅ Make Better Decisions Backed by Hard Data
Imagine running a business where you don’t even have any idea what kind of people need your products or even what they need.
That’s a bit like driving a car while blindfolded. Nothing good can come out of that. You will end up losing your money, resources, or even worse — your reputation.
On the other hand, tracking website KPIs unlocks raw data and insights that can help you make the right calls. As a result, you can guide your team in the right direction for better ROI.
Bottom line: Only 8.4% of websites bother to use any tracking software. So, when you track your web metrics performance, you are able to outrank your competitors easily (or at least more easily).
7 Web KPIs to Track for SEO
Wondering which of the many website key performance indicators you should track? Don’t worry. We’ve got you covered. While there are many things you can track, start by keeping an eye on the following ones first:
#1 Unique Visitors
This is definitely at the top of the list of key website metrics. A unique visitor is a basic yet important metric. Why? Because this metric counts each person only once. That’s why it is more descriptive than, say, clicks, as you only pay attention to the actual number of users.
For example, imagine that 100 people landed on your website and visited different pages. Some of them viewed just one page. Others went back and forth, checking multiple pages in different sessions.
No matter what people do on your site, the number of unique visitors for that given period will still be 100.
📈 How to Track It:
There are several options available to you in terms of the tools you can use to track your unique visitors. But the most common one is Google Analytics, which is also free (a nice bonus, right?).
To use this, all you have to do is:
- Log in or create an account if you are new to the platform.
- Go to Reports → Life Cycle. There, you can see a metric called Total users, which measures your unique visitors.
Note: You can go through different categories (e.g., Acquisition, Engagement) to track your performance from different points of view. For example, if you go to the Engagement → Events, you’ll see what people did.
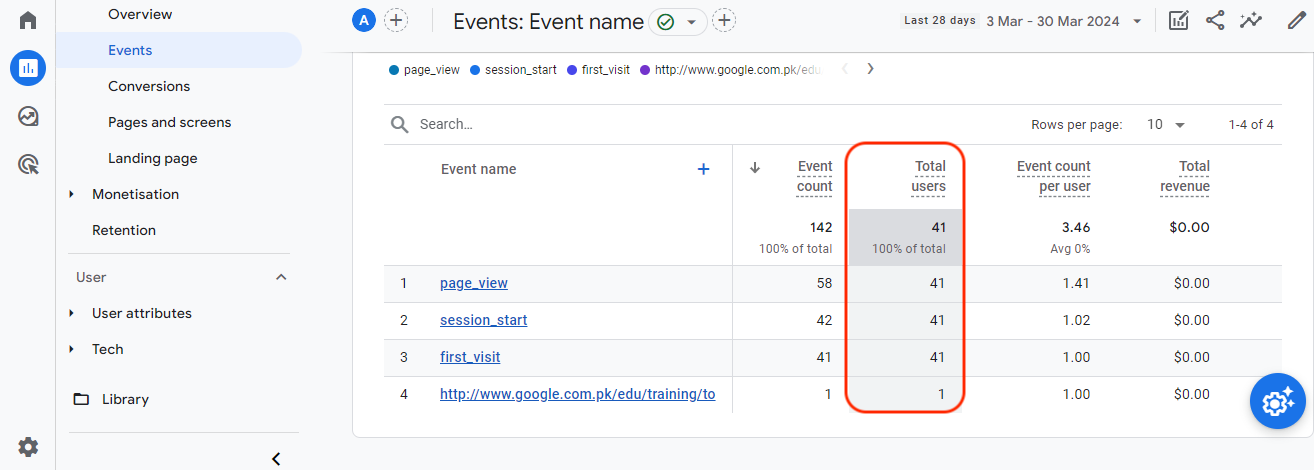
Source: Analytify
If you want to delve deeper, click on User reports to see a breakdown of their demographics, geographies, etc.
💡Tip: In case you don’t have the Total users metric in some of your reports, you can customize them. Do that by clicking on the pencil icon (Customize report) → Metrics → Add metric → Total users.
#2 Page Views
This is one of the key web analytics metrics to monitor. This is the number of times a person opens a web page. So, each time that web page gets loaded, it counts as a page view.
So, when the number goes up, that is a sign that more people are finding your website engaging. Plus, the webpage that gets the most pageviews is the one that most people love.
This is a big deal when you are working on using guest posts and niche edits to grow your organic traffic. If the page linked in the guest blog gets a ton of pageviews compared to the previous month, then it is a sign that your strategy is working.
📈 How to Track It:
This is another metric you can track for free in GA. To do that, simply log in to your Google Analytics → Reports → Engagements → Pages and Screens.
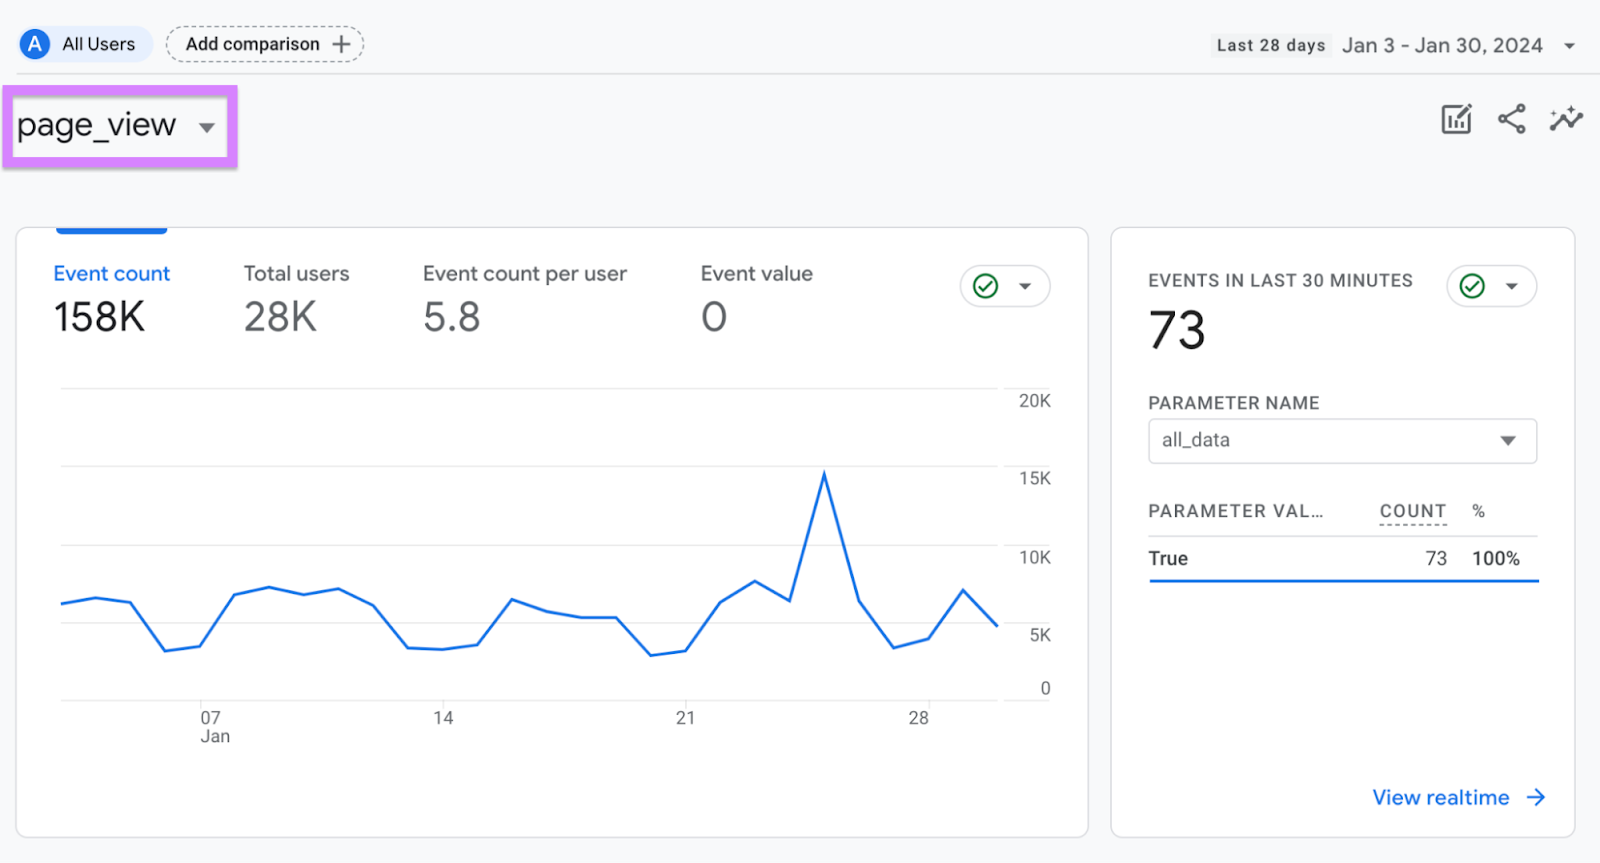
Source: Semrush
#3 Bounce Rates
While the term “bounce rate” might sound a bit fun, it is the exact opposite when you are tracking key metrics for website performance.
Bounce rates refer to the number of people who land on your website and exit without performing any action. Typically, this means that users aren’t really interested in your content or don’t find the answers they’re looking for.
The higher the bounce rate, the poorer your search rankings will be. Why is that? Well, a high bounce rate is a clear indication that something is wrong with your site. It could be that the content is not valuable, your website is slow, the navigation is complicated, or something else.
📈 How to Track It:
Guess what? This is another metric you can track in your Google Analytics. We hope you have your account set up by now.
If so, go to Reports → Engagements → Pages and screens. There, you will find different metrics, and bounce rate is one of them.
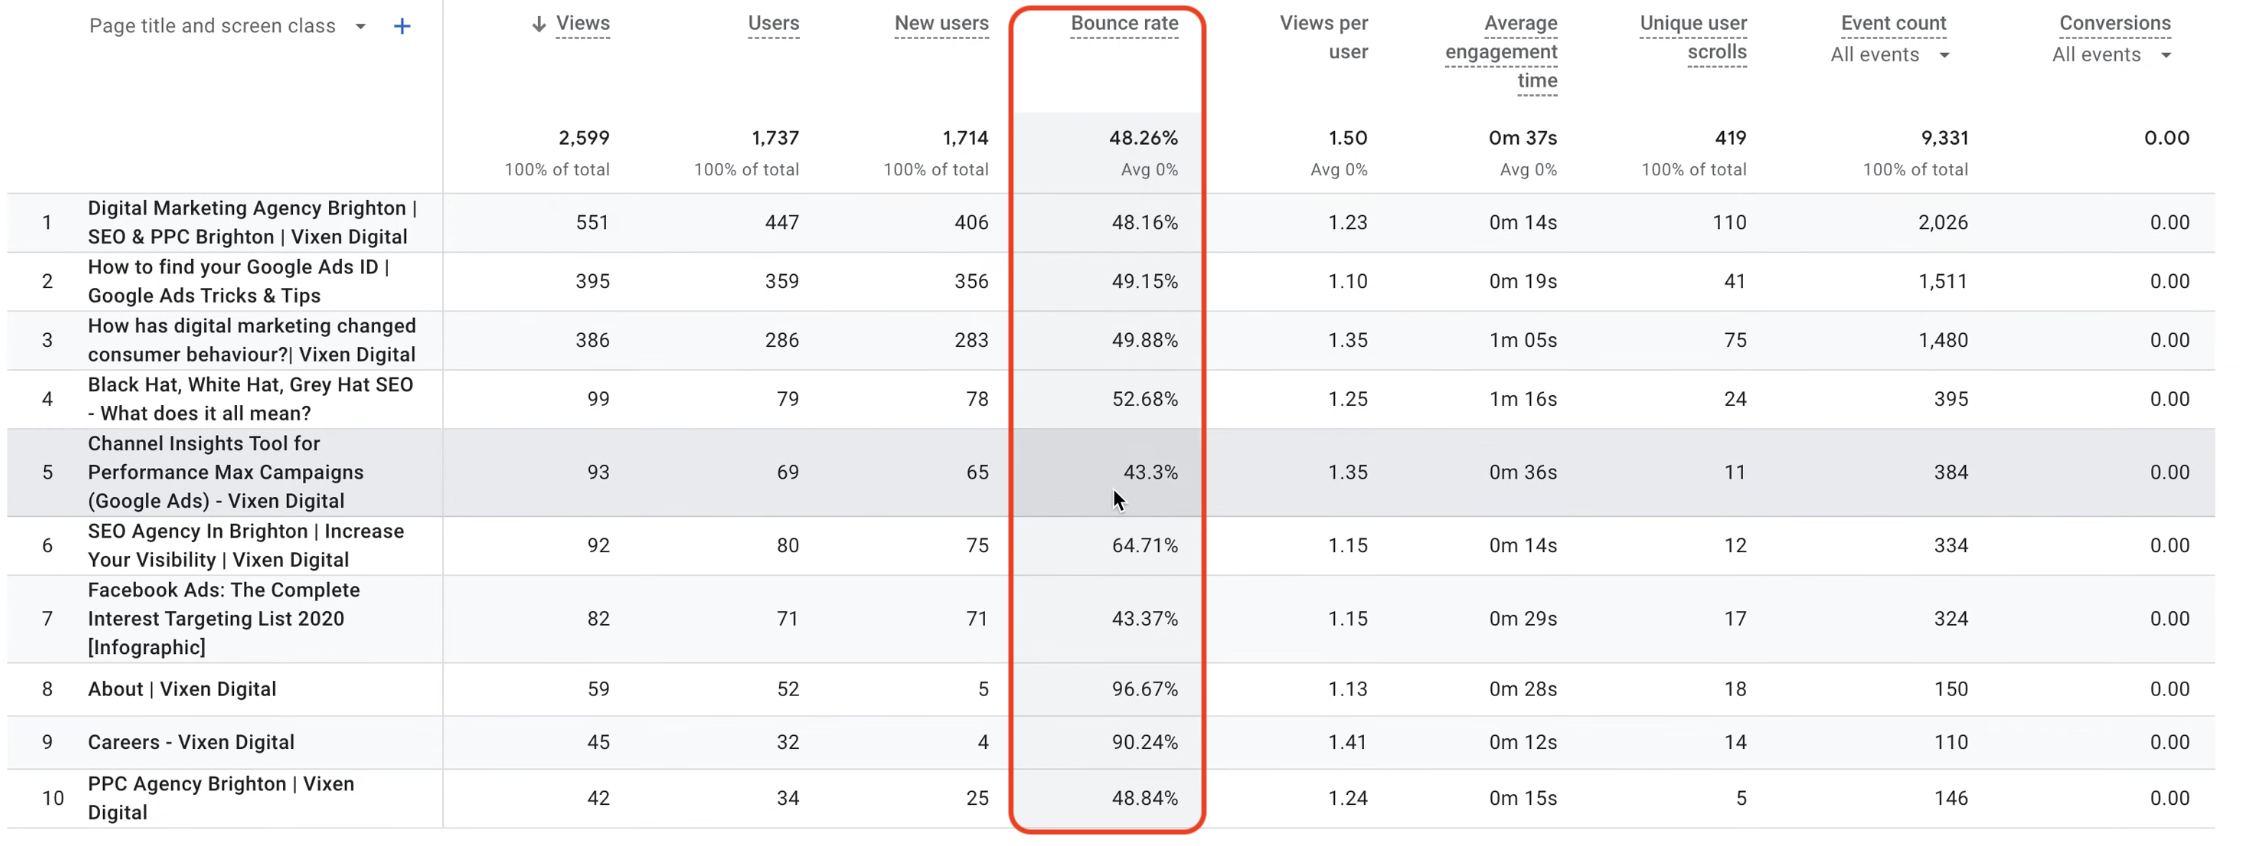
Source: YouTube
You can also check bounce rate through Acquisition → Traffic acquisition if you want to see whether users that come from different sources also act differently.
Don’t see bounce rates? No worries. You just need to customize your report.
Just click on the little pencil icon in the top right corner, and you will see a little pop-out that will allow you to add a bounce rate to your menu.
🤓 What is a good bounce rate?
Now, we hear you asking this question. While it can vary, on average, you can keep these benchmarks in your mind:
- Below 30% — You’re doing great! Well done!
- 30-50% — It’s a normal bounce rate.
- 50-70% — While this is a medium bounce rate, something is probably wrong.
- Over 70% — Your website definitely cries for help.
#4 Page Load Time
Page load is basically how long it takes for your web page to fully load and display on your visitor’s screen. Again, it is really one of the most important metrics for website performance and is measured in seconds. Why seconds and not minutes?
Well, the word is that modern humans now have the attention of a caffeinated squirrel, so you know… Jokes aside — 53% of mobile users abandon pages that take longer than three seconds to load.
📈 How to Track It:
The easiest free way to track your site speed is by using PageSpeed Insights. It is also a free online tool that doesn’t require any setup and gives you a pretty detailed description of your web performance.
Besides, you don’t have to be an expert to use it. Just copy-paste your website URL, wait for a bit, and enjoy your web performance report.
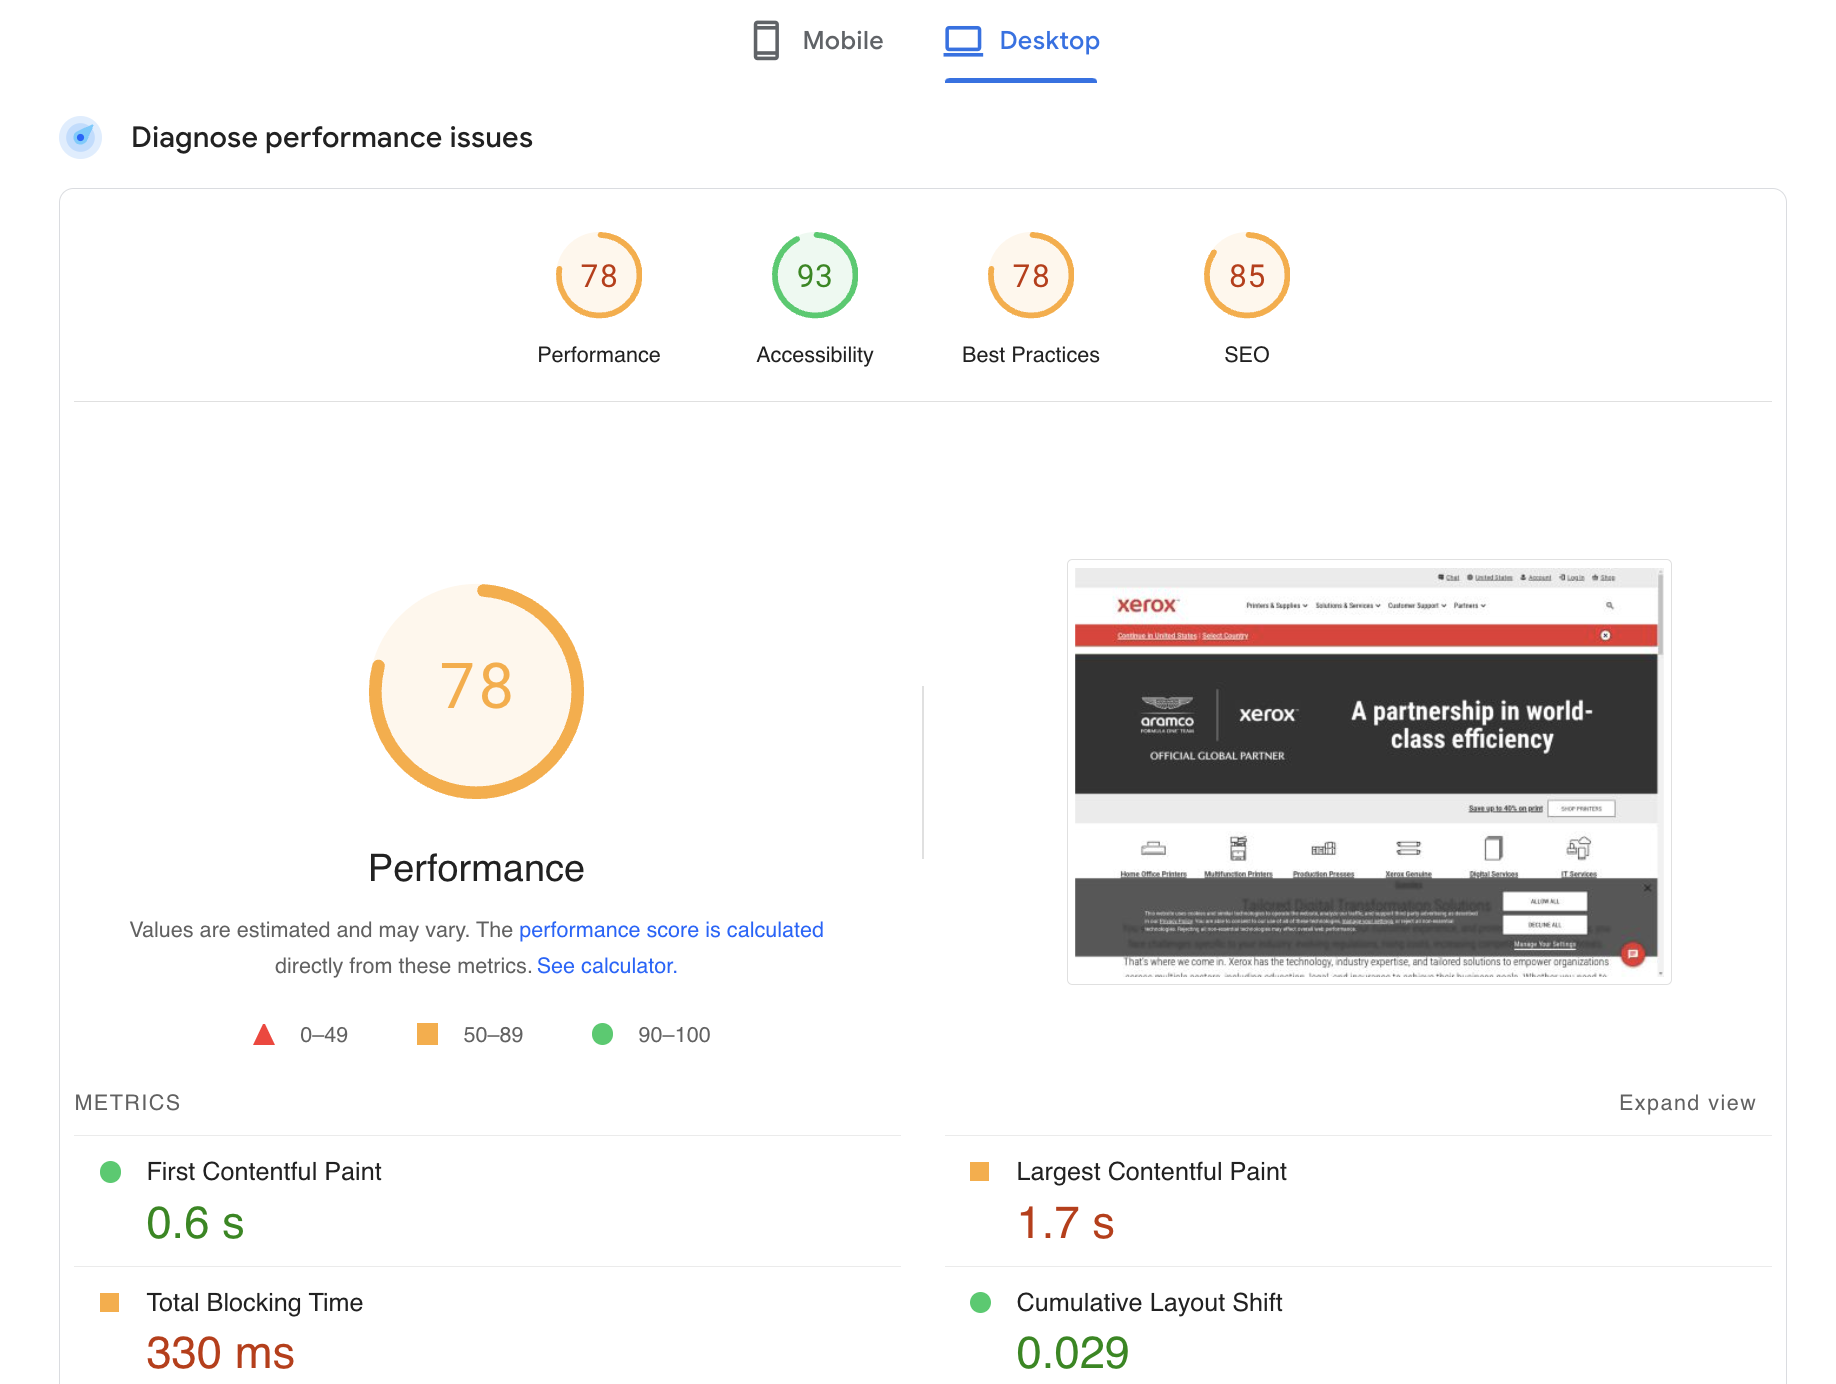
Source: PageSpeed Insights
You can also do a free website audit with Semrush or Ahrefs, and they will notify you about any slow pages if you have them.
#5 Traffic Source
Another important website metric is the traffic source. This tells you where the visitors that land on your website are actually coming from. Again, this is a metric that helps you understand what sources are the most effective for your business.
Some people will find your site through Google search. This is what’s called organic traffic. Others might come from social media, email marketing, referrals, and so on.
By knowing your traffic source, you will easily understand what to prioritize in your future marketing strategies.
📈 How to Track It:
There are many tools you can use to check where your website visitors are coming from. Again, you can start by going to your Google Analytics report (what a surprise!). Simply navigate to Life cycle → Acquisition → Traffic acquisition.
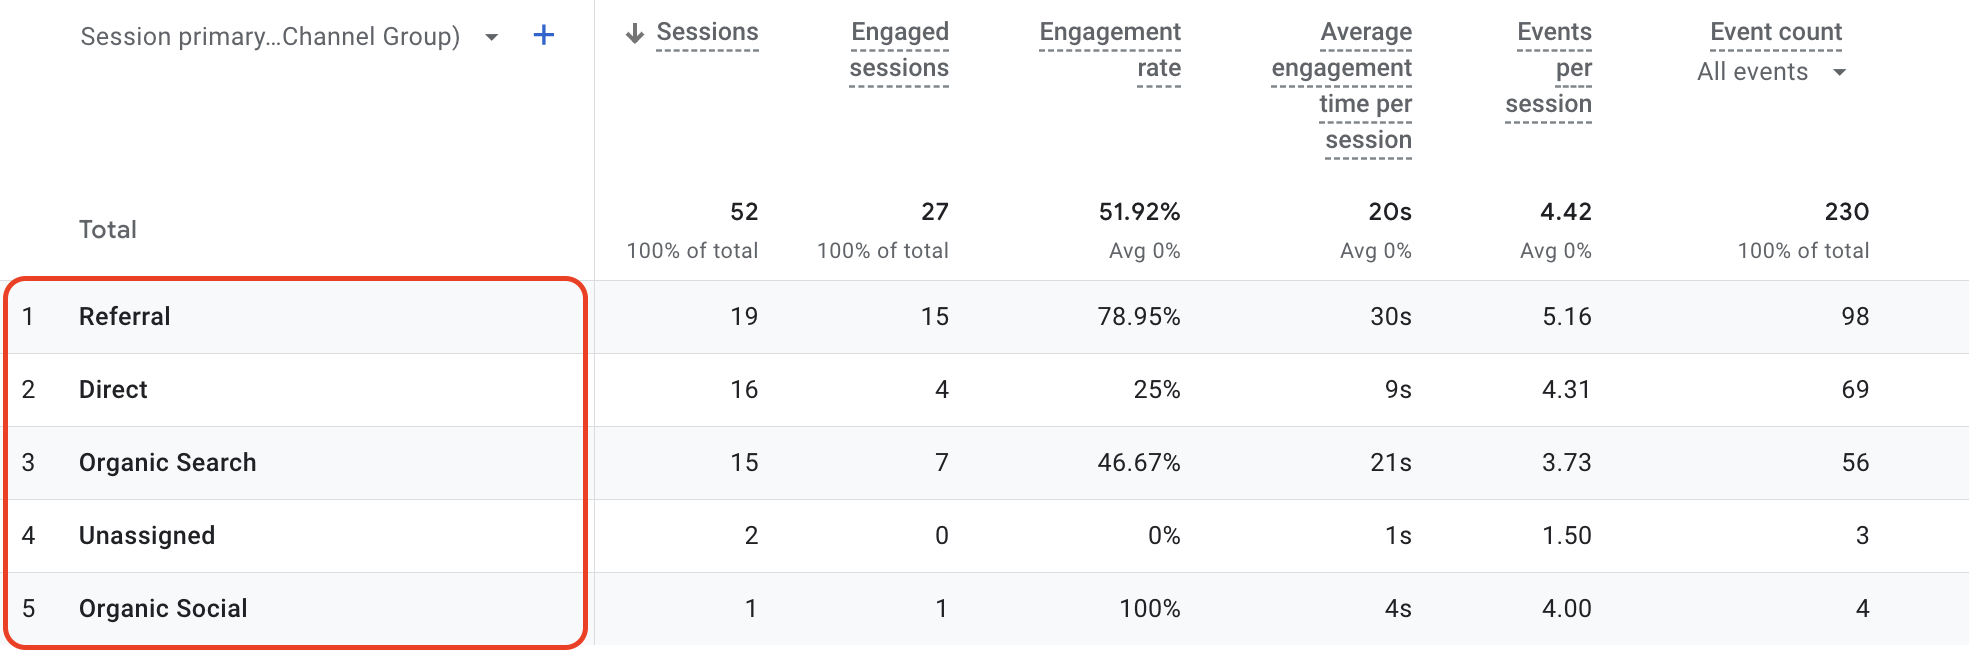
You can also use tools like Semrush for this one. All you need to do is go to the menu on the left and select Domain Overview.
Once you enter your domain address, you get back a detailed result with your domain score as well as organic and paid search traffic data. You will also see a breakdown of traffic by country, keywords, etc.
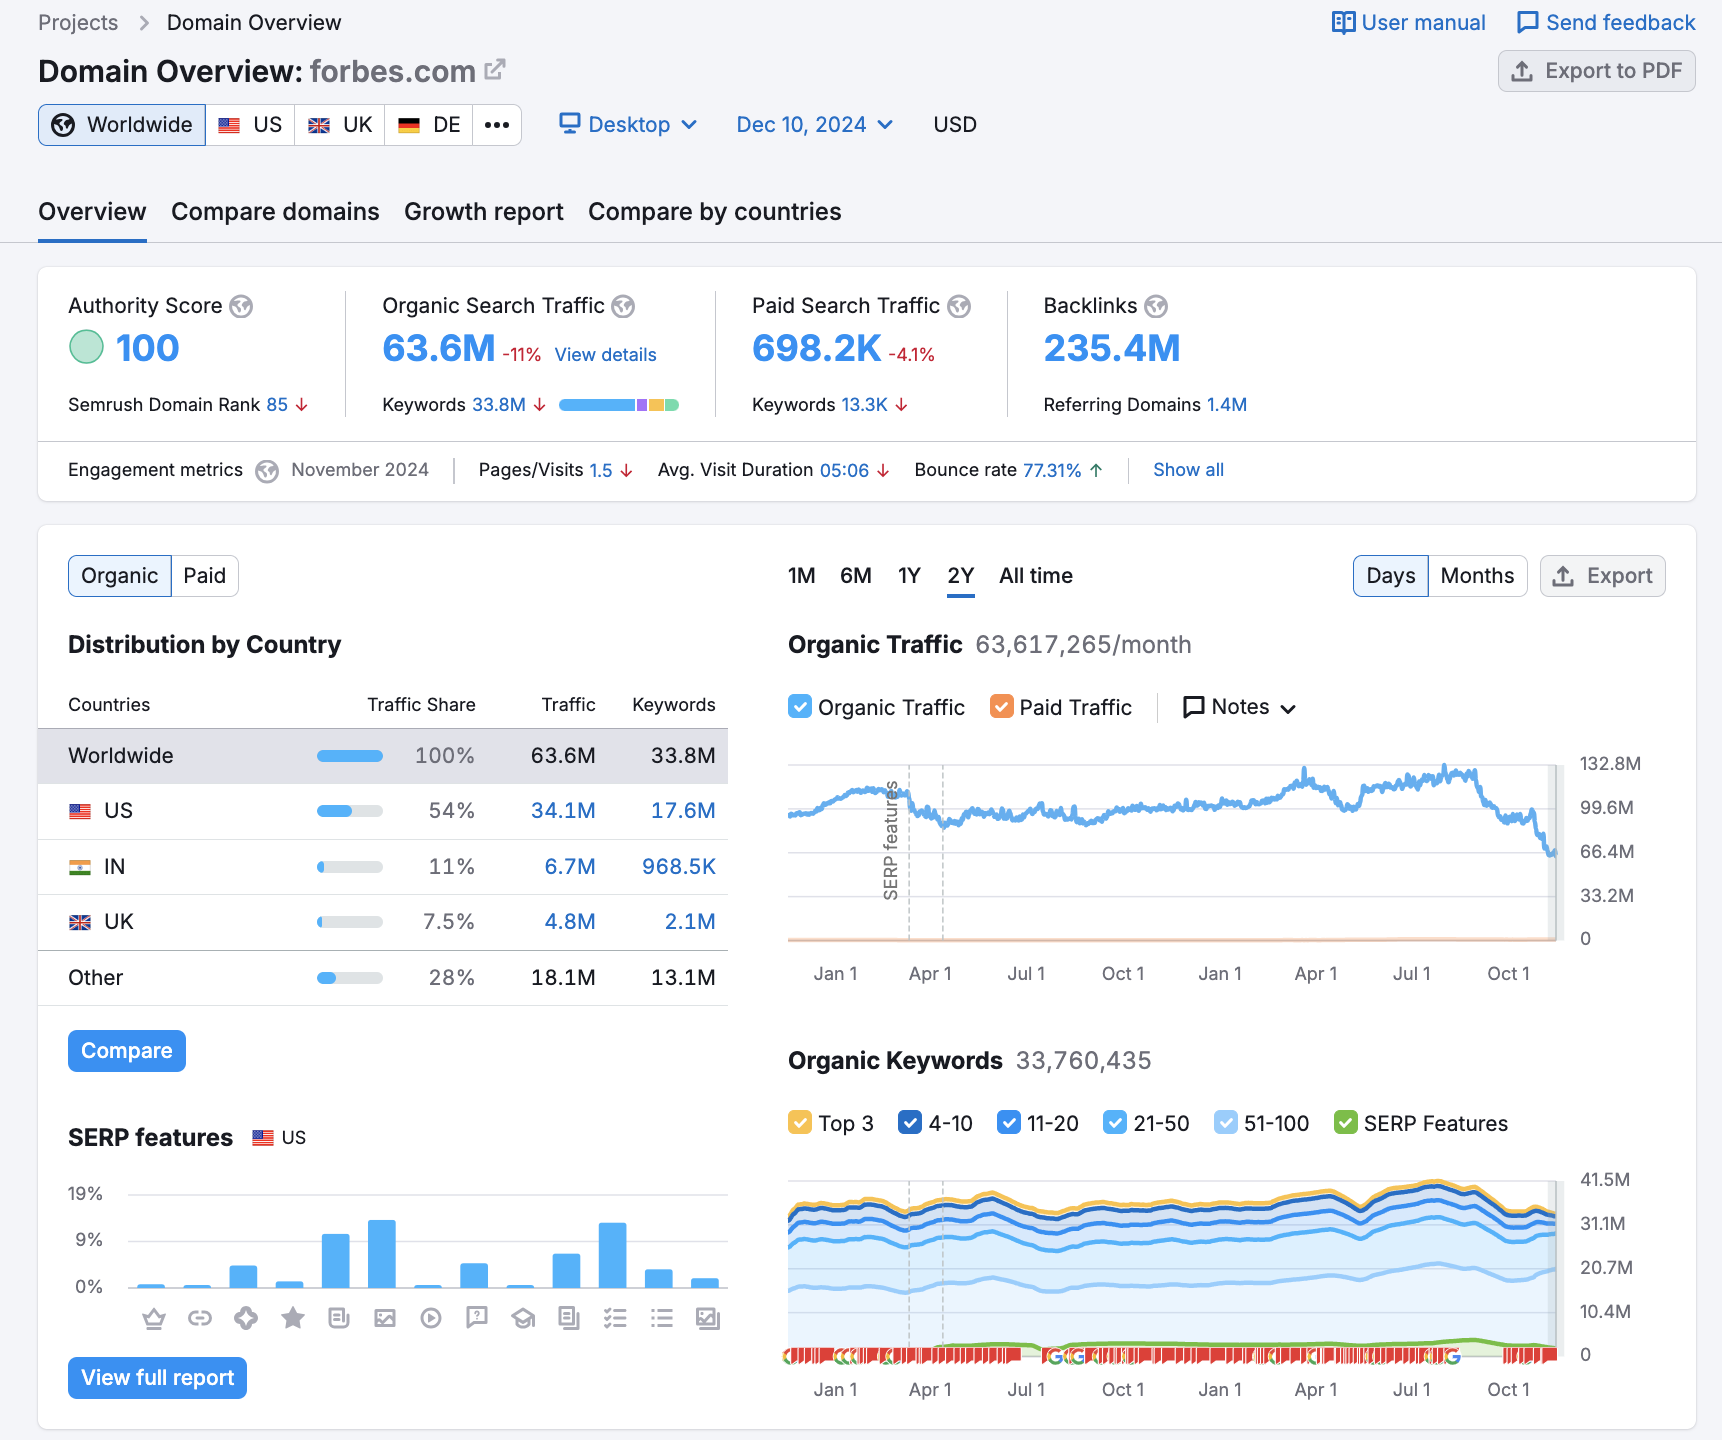
Source: Semrush
💡Pro tip: you can also do the same when you want to do a little spying on your competitor’s traffic.
#6 Conversion Rate
You know how all that traffic comes from many different places, right? Well, not everyone who comes in will actually convert. So, how do you know how many users do? This is where tracking web analytics key metrics and KPIs, like conversion rates, come in.
Conversion rate is basically the number of people who went on to take a desired action after checking your site. This could be as simple as signing up for a newsletter, filling out the form, or something else like making a purchase.
There’s nothing like seeing a casual website visitor transform from a window shopper to a committed customer. As you could have guessed — the higher the conversion rate, the more revenue you make.
If nothing else, now you know that you are getting the right audience. Plus, your content is good enough to get them to take the action you want.
📈 How to Track It:
Now, there are different ways to track your conversions. Here, we’ll focus on those that are available to you in Google Analytics.
Basically, in GA, you can monitor:
- Session conversion rate
- User conversion rate
None of those are actually available to you by default, so you’ll have to set them up. For this, go to Life cycle → Acquisition → Traffic acquisition. Then, click on the pencil icon in the top right corner, click on Metrics → Add metric and select Session Conversion Rates.
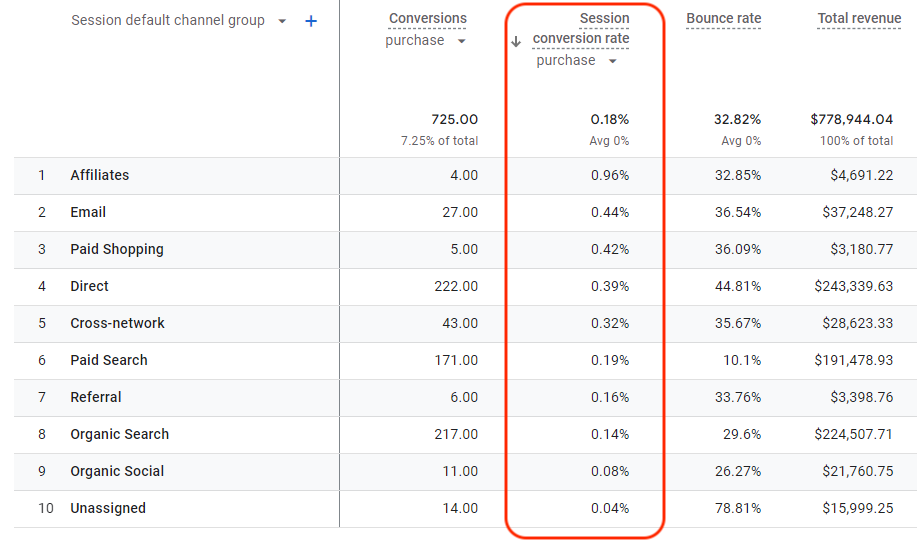
❗Important: But here is the thing: you won’t see Session Conversion Rates if you don’t have any conversion events set up.
To do that, go to your Admin panel by clicking on the gear icon in the lower-left corner of your page. Then, navigate to Event and click Create Event.
Now, depending on what event you want to track, proceed with the setup. The best rule of thumb is to find a particular guide for every event you need because there might be some hidden details.
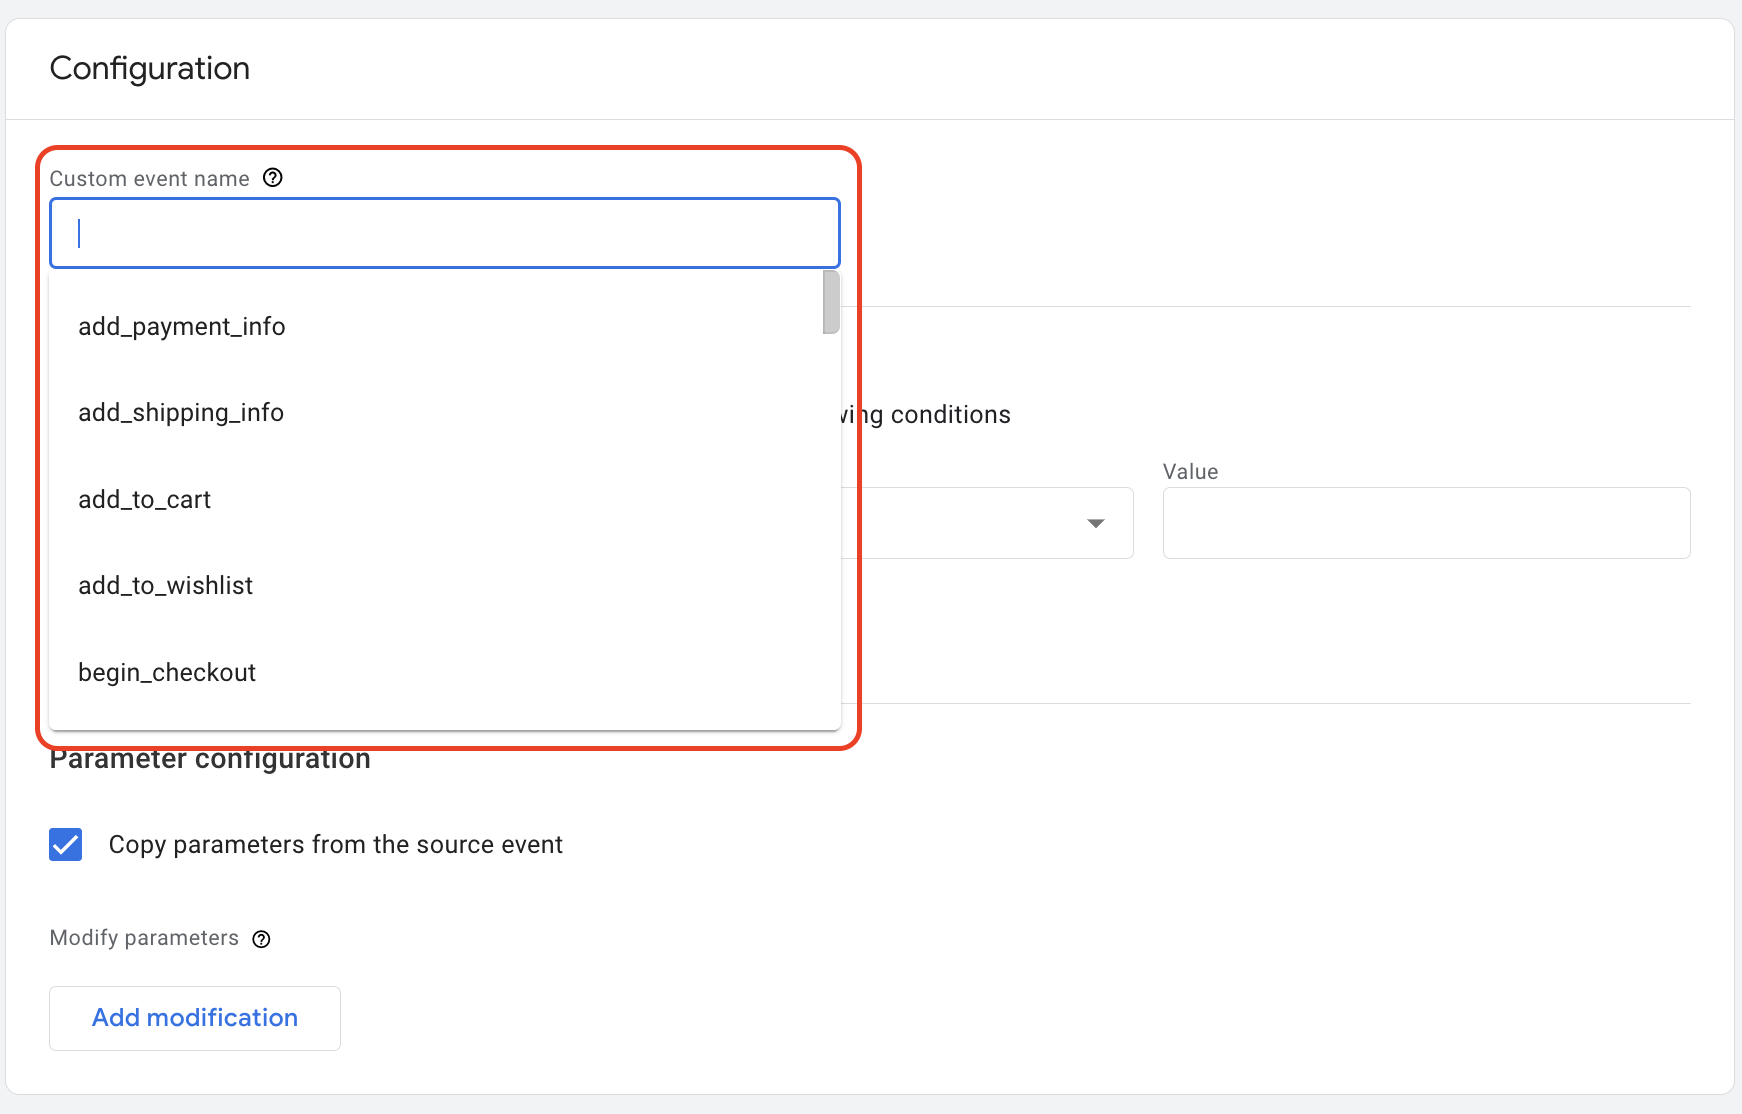
Then, you’ll see your newly created event on the Event page. Just make sure to switch on the Mark as conversion toggle.
🤓 How is the conversion rate calculated?
If you’re wondering how this specific website traffic KPIs is calculated, here you go:
The number of conversions ÷ the total number of visits × 100%.
So, if you had 5000 visitors in November and 1700 of them downloaded your ebook, that means your conversion rate is 34%.
#7 Average Session Duration
If you own a blog, you probably wonder if people are still interested in blogs. If so, this is one of the top blog KPIs to watch out for. It tells you how long your readers spend on your site per session on average.
If this number is high, it’s a sign that your content is really interesting. Plus, it also means that you’re attracting relevant traffic with people who can actually appreciate what you’re sharing.
📈 How to Track It:
To track this particular KPI web analytics metric, you will follow the usual steps. Google Analytics, again? Yes, sir! Navigate to Life cycle → Acquisition → User acquisition or Traffic acquisition.
If you don’t see that metric there, you already know the drill by now — simply add it by clicking on the pencil icon in the upper-right corner of the page.

Like the previous KPI website, this one also has a special formula. It is calculated by dividing the total number of time your users spend on your site by the number of sessions.
Conclusion
This was an information-dense guide, so if you’re still here, we’re proud of you. Now, you know so much about website usage metrics and how to measure website performance.
Since there are so many metrics you can include in your website metrics report, start small and then expand from there. It is, anyway, better than nothing.
If all this data makes you overwhelmed and you don’t know what to do with it to make it more digestible, try using some data visualization tools. They can help you visualize your information in an understandable way.

Enter URL & See What We Can Do Submit the form to get a detailed report, based on the comprehensive seo analysis.


